Warning
These functions can produce additional visualizations but are not as
soundly backed by our methodology and are subject to drastic change
throughout versions of prolong.
delta_scatter() Function
The delta_scatter() function can show a 2D or 3D
scatterplot of pairwise delta-scale correlations to view the
relationship between these pairwise correlations across time. The
default is a 2D interactive scatterplot with hovertext for each point,
and with fisher z-transformation applied to the pairwise
correlations.
delta_scatter(sim_metabs) If interactive = FALSE a non-interactive version will be
shown without the hovertext. We can also change timediff1
and timediff2 to compare different time point pairs. If we
set fisherz = FALSE, the raw pairwise correlations will be
shown.
delta_scatter(sim_metabs, timediff1 = "3-2", timediff2 = '4-3', interactive = FALSE, fisherz = FALSE)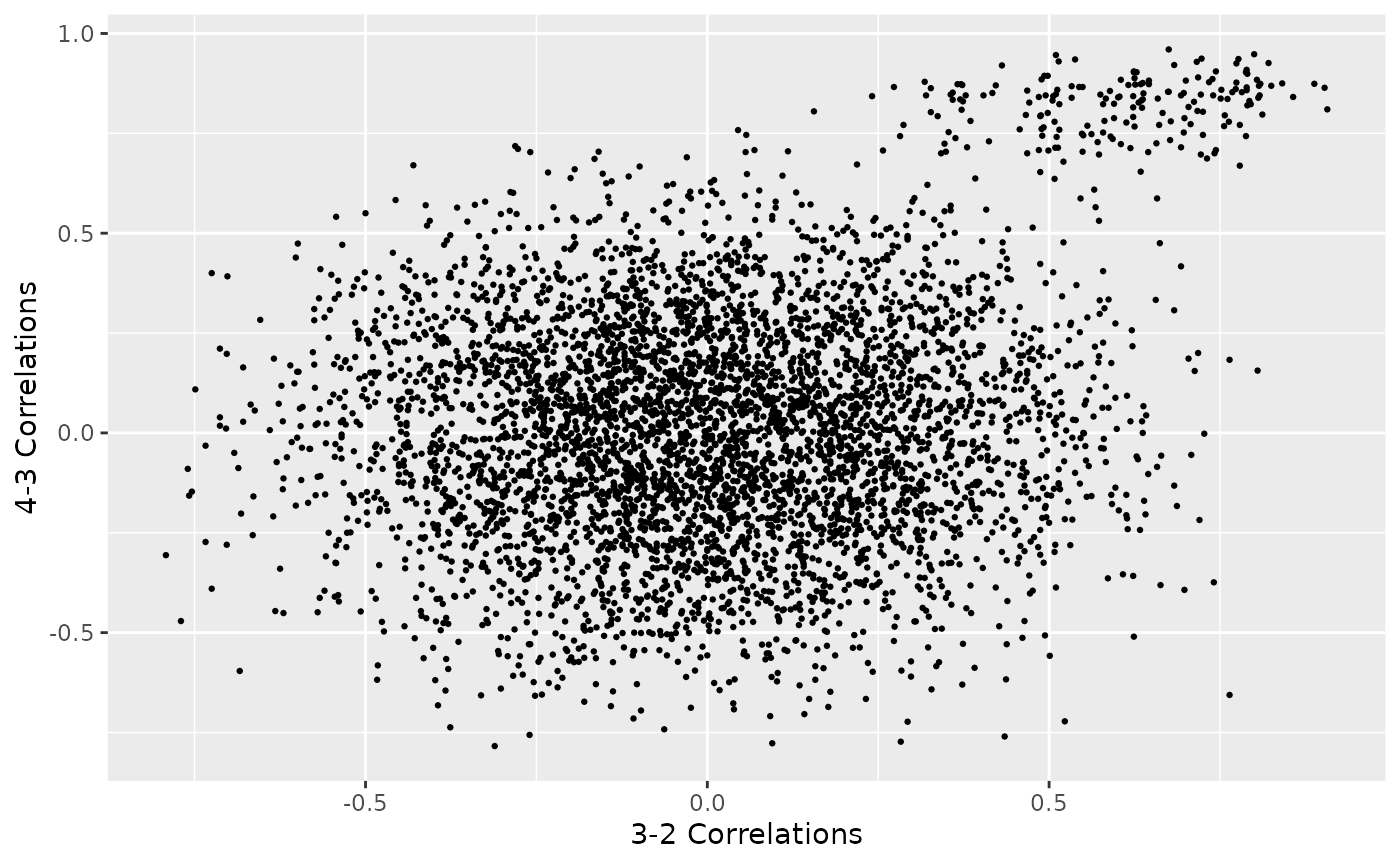
For 3D scatterplots, we can repeat the above but specify
timediff3. Setting interactive = FALSE will
not change anything if timediff3 is supplied, only an
interactive option is currently available. We use a subset of the
variables here to reduce the file size of the rendered html.
delta_scatter(sim_metabs[,1:20,], timediff3 = '4-3')
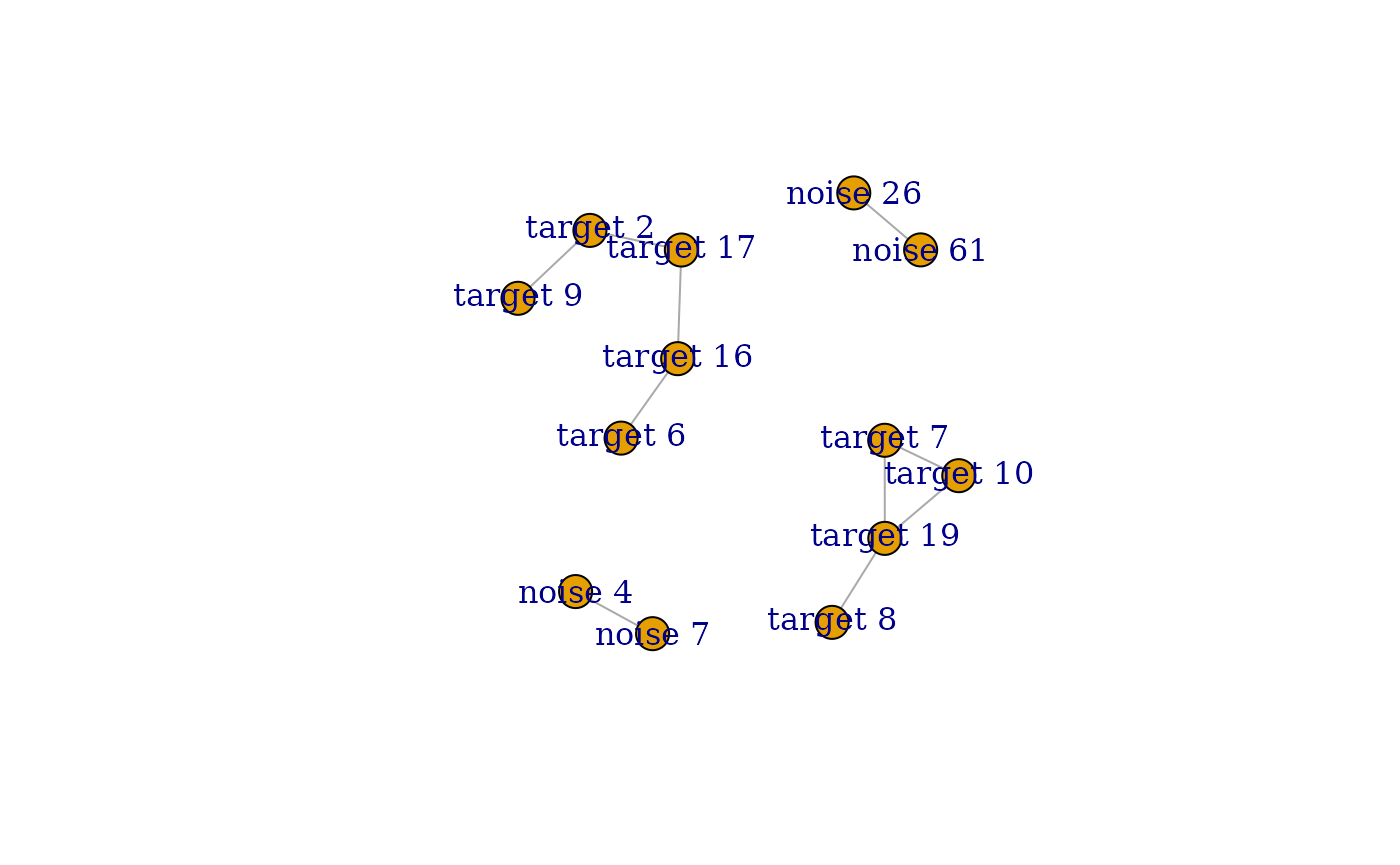
delta_network() Function
The delta_network() function plots a network where the
nodes are the \(p\) variables and edges
exist only between pairs of variables whose (partial) pearson
correlation is greater than corr_thresh. The default is an
interative network plot with edges between pairs of variables with
partial correlation greater than \(0.75\).
delta_network(sim_metabs)As in delta_scatter() we can view a static plot instead
with interactive = FALSE. We can also change the
correlation threshold with corr_thresh, set
partial = FALSE to use regular pairwise correlations, and
change method to either "kendall" or
"spearman" instead of the default
"pearson".
delta_network(sim_metabs, timediff = "3-2", partial = FALSE, corr_thresh = 0.8, interactive = FALSE, method = "spearman")